
No business process can be optimized without accurate data to work with. In the case of maintenance, it’s the same. For this reason, it’s important to track key performance indicators to effectively measure the performance of the maintenance team, it’s important to track key performance indicators to effectively measure performance of the maintenance team. You may improve your maintenance management with the use of these measures, which will lead to fewer breakdowns, less superfluous maintenance, and more productive teams. This post will discuss the KPIs for measuring maintenance team performance and how to use them to boost your maintenance team’s performance.
What is the maintenance KPI?
KPIs are used to monitor the success of an individual, team, project, or business over time and assess the degree to which objectives have been met. Key performance indicators for maintenance monitor how well your firm achieves maintenance goals like reducing downtime and costs. They are markers of where your team is in relation to where you want it to be.
What are maintenance metrics?
Metrics for maintenance performance reveal insights into the health of your maintenance group and infrastructure. When managers use performance metrics, they can compare the level of daily maintenance to goals that have been set.
Insight into your strengths, weaknesses, and growth opportunities is facilitated by familiarity with your statistics. Metrics reveal the cumulative impact of routine actions. You’ll have more insight and command over maintenance operations and access to actionable strategies for boosting efficiency.
What is the difference between maintenance KPIs and maintenance performance metrics?
Commonly used interchangeably, maintenance key performance indicators (KPIs) and maintenance performance metrics are distinct concepts. As we’ve seen, maintenance metrics monitor the health of a particular process, while maintenance KPIs are numbers that demonstrate how well you’re meeting maintenance goals.
Maintenance key performance indicators are more strategic, whereas maintenance performance measures are more operational. Key performance indicators are like a compass that points in the direction we want to go, whereas metrics focus on the specific actions that will bring us there.
Let’s think about a scenario that’s common in the business world. Your company’s deferred maintenance backlog will be reduced by 30 percent by the end of the next quarter, a KPI you’ve set. Your research has revealed that routine maintenance is suffering as a result of the prevalence of unplanned repairs. There may not be enough people working in the department, which makes it hard to get work orders done quickly.
Measuring items like maintenance overtime, benchmarks, the proportion of on-time work orders, and the proportion of planned maintenance can help shed light on the situation and pave the way toward a solution. Measurements of upkeep like these are essential.
KPIs for measuring maintenance team performance
The process of creating and monitoring maintenance-related key performance indicators often begins when upper management outlines the company’s overarching objectives. After these company-wide goals have been set, managers and directors can create goals and plans for their own departments that are in line with the company’s overall goals.
In order to decide which maintenance KPIs are most important to monitor, you, as the maintenance manager, must first identify your most pressing maintenance issues. Consider the weak links in your team’s deliverables. Equipment failures are a common problem, as is the time spent by your staff on emergency repairs. In order to get your business where it needs to go, you need to fix one of these issues. Using this data, you may make a list of the problems and begin classifying them.
1. Unscheduled downtime
The amount of unscheduled downtime is a reliable indicator of the success of a maintenance plan. In industries where capital equipment plays a significant role, such as manufacturing, unscheduled downtime can rack up significant costs. Counting how often something breaks down as well as how long it takes to fix it is part of this metric. Attaining zero hours worked is an ideal goal.
Unscheduled Downtime% = Hours of Unscheduled Downtime divided by Total Period Measured (including Scheduled Downtime) multiplied by 1000
2. Cost of maintenance
At present, this metric has become widespread throughout several sectors. Most likely, it has already manifested itself in your company. It is the sum of all the maintenance expenses needed to produce one unit of output. Costs per unit of output are of paramount importance to industries such as steelmaking, brewing, and automobile manufacturing. You get the idea. Monthly, quarterly, or yearly measurements are common for maintenance expenses per standard unit of production. This provides valuable insight into how the company’s maintenance costs compare to the cost of goods produced over the course of the product’s life cycle. The maintenance cost metric is adaptable, so it can be used for a single asset, a group of assets, an entire plant, or even multiple plants within the same organization.
Total maintenance cost divided by the number of units produced equals maintenance unit cost.
3. Mean Time Between Failure (MTBF)
The MTBF measures how long an asset lasts before completely breaking down. The time required for a failure to occur is recorded. Improving the Mean Time Between Failure (MTBF) of mission-critical machines can boost output and enhance the effectiveness of your maintenance plan generally.
Number of Operational Hours / Number of Failures = MTBF
4. Mean time to repair (MTTR)
How long it takes your maintenance team, on average, to fix a broken asset is known as its mean time to repair. This metric tracks the time it takes to identify, repair, and recover from maintenance issues. A low MTTR is a great indicator of maintenance inefficiency.
Total Maintenance Time/Number of Repairs = MTTR
5. Cycle Time for Work Orders
In order to reduce operational and maintenance costs and increase efficiency, improving the effectiveness of the work management process is essential. Work order cycle time is the metric used to measure how long it takes from when a work order is created until it is technically closed in CMMS software. The time spent on various stages of a project, from inception to finalization, will be analyzed. You should dig deeper into the factors if your average trend is rising. Spare-part ordering delays can occur for a number of reasons, including insufficient resources, poor planning, or longer-than-anticipated wait times. The simple calculation is
WO cycle time is calculated as follows: WO completion date – WO creation date
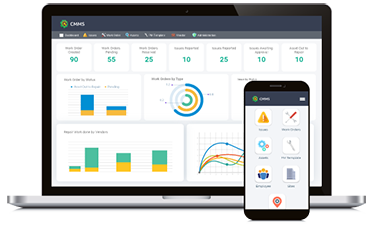
Using CMMS software can give you the right data that can help you measure the KPIs mentioned above. When measuring KPIs, you need to make sure you have accurate data, and CloudApper CMMS can help get the right data right into your dashboard. If you are worried about the KPIs of your maintenance team, CloudApper CMMS can help.