The major characteristic that can set you apart from your direct competitors is the adoption of sales analytics. There have been the development of new sales analytics software as a result of advancement in data and technology that has helped to gain more insight into the sales process.
Such data has helped to train and provide guidance to sales teams and ultimately increase revenue. Taking advantage of these can give your business a head start and help you stay ahead of your competition when you gain accurate and valuable insights.
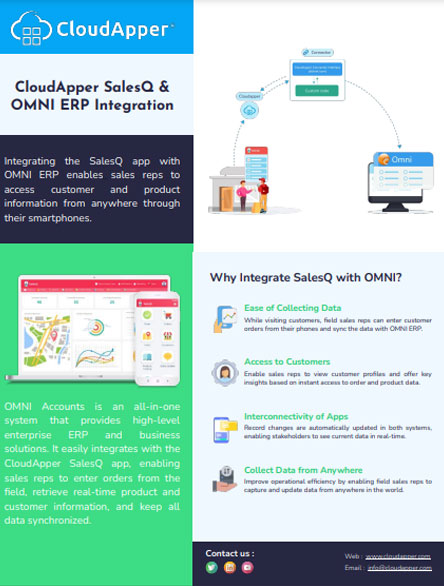
With such tools, you can automate the business process and ultimately improve performance from analyzing the data obtained. CloudApper SalesQ can help to analyze data from sales metrics that can help to simplify and improve upon the sales process. Here are some ways in which data analytics can be implemented into the field sales process:
Determine Data That Needs Interpretation
You need to understand what kind of data should be tracked and when the tracking should be done in a bid to set up the correct analytics. Monitoring sales performance can be done daily with the tracking of targets and revenues generated from each field sales day activity.
SalesQ enables easy tracking of metrics such as target completion rates, amount of revenue generated, it helps to sort out top buying customers. These data can then be leveraged to better manage sale reps and accurately convert prominent customers.
Use an App to Collect Data
You can also use sales analytics software to gather and manage sales targets and data on orders made by the reps to provide reports on delivery completions, units shipped to customers, and visit completion. These provide the necessary data that can be used to form comprehensive reports measuring sales performance. It brings ease compared to the traditional use of pen and paper methods.
Visualize Data
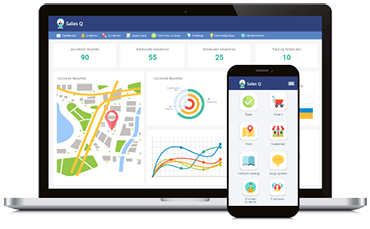
It is hard to process sales data if it cannot be viewed for easy absorption. The goal of sales analytics is to recognize the trends in data collected and then analyzed them to be represented graphically as charts or histograms to enable easy understanding.
SalesQ automatically processes sales data and presents it as different charts as you may prefer– bar charts, pie charts or histograms and maybe all of it– it enables easy insight into the data.
Identify Latent Trends
You can identify potential hot spots on your sales charts when you can identify products that sell fast and the regions where higher sales of a particular product are common.
A sales analytics software can be used to track the orders of customers and the locations of your sales reps. It helps to focus on the best selling products in higher quantities. The best sales reps can be sent to high-yielding or more profitable areas to increase revenue.
Implement Sales Analytics to Generate More Sales
With the insight offered by sales analytics, you can use them to improve the sales operations process and increase sales. Prepare a flexible schedule that allows you to recognize trends in data collected.
Using this, you can discover insights that will help you predict the results of sales operations and you can make adjustments to yield more revenue. SalesQ is an important tool that can be used to enhance the selling process by keeping tabs on the sales data collected over a period through the phones of reps.
It is the best way to secure more leads and increase revenue for your organization. A sales analytics software makes it possible to make data entries and collect sales data directly from the mobile phones of sales reps to get a clear insight into the field sales activity. CloudApper SalesQ is a relevant tool in data analysis of sales metrics that can help to increase revenue. Interested in trying out the app? Contact us today!